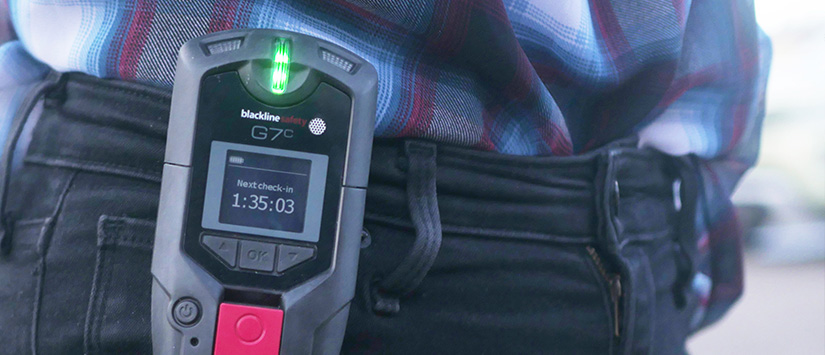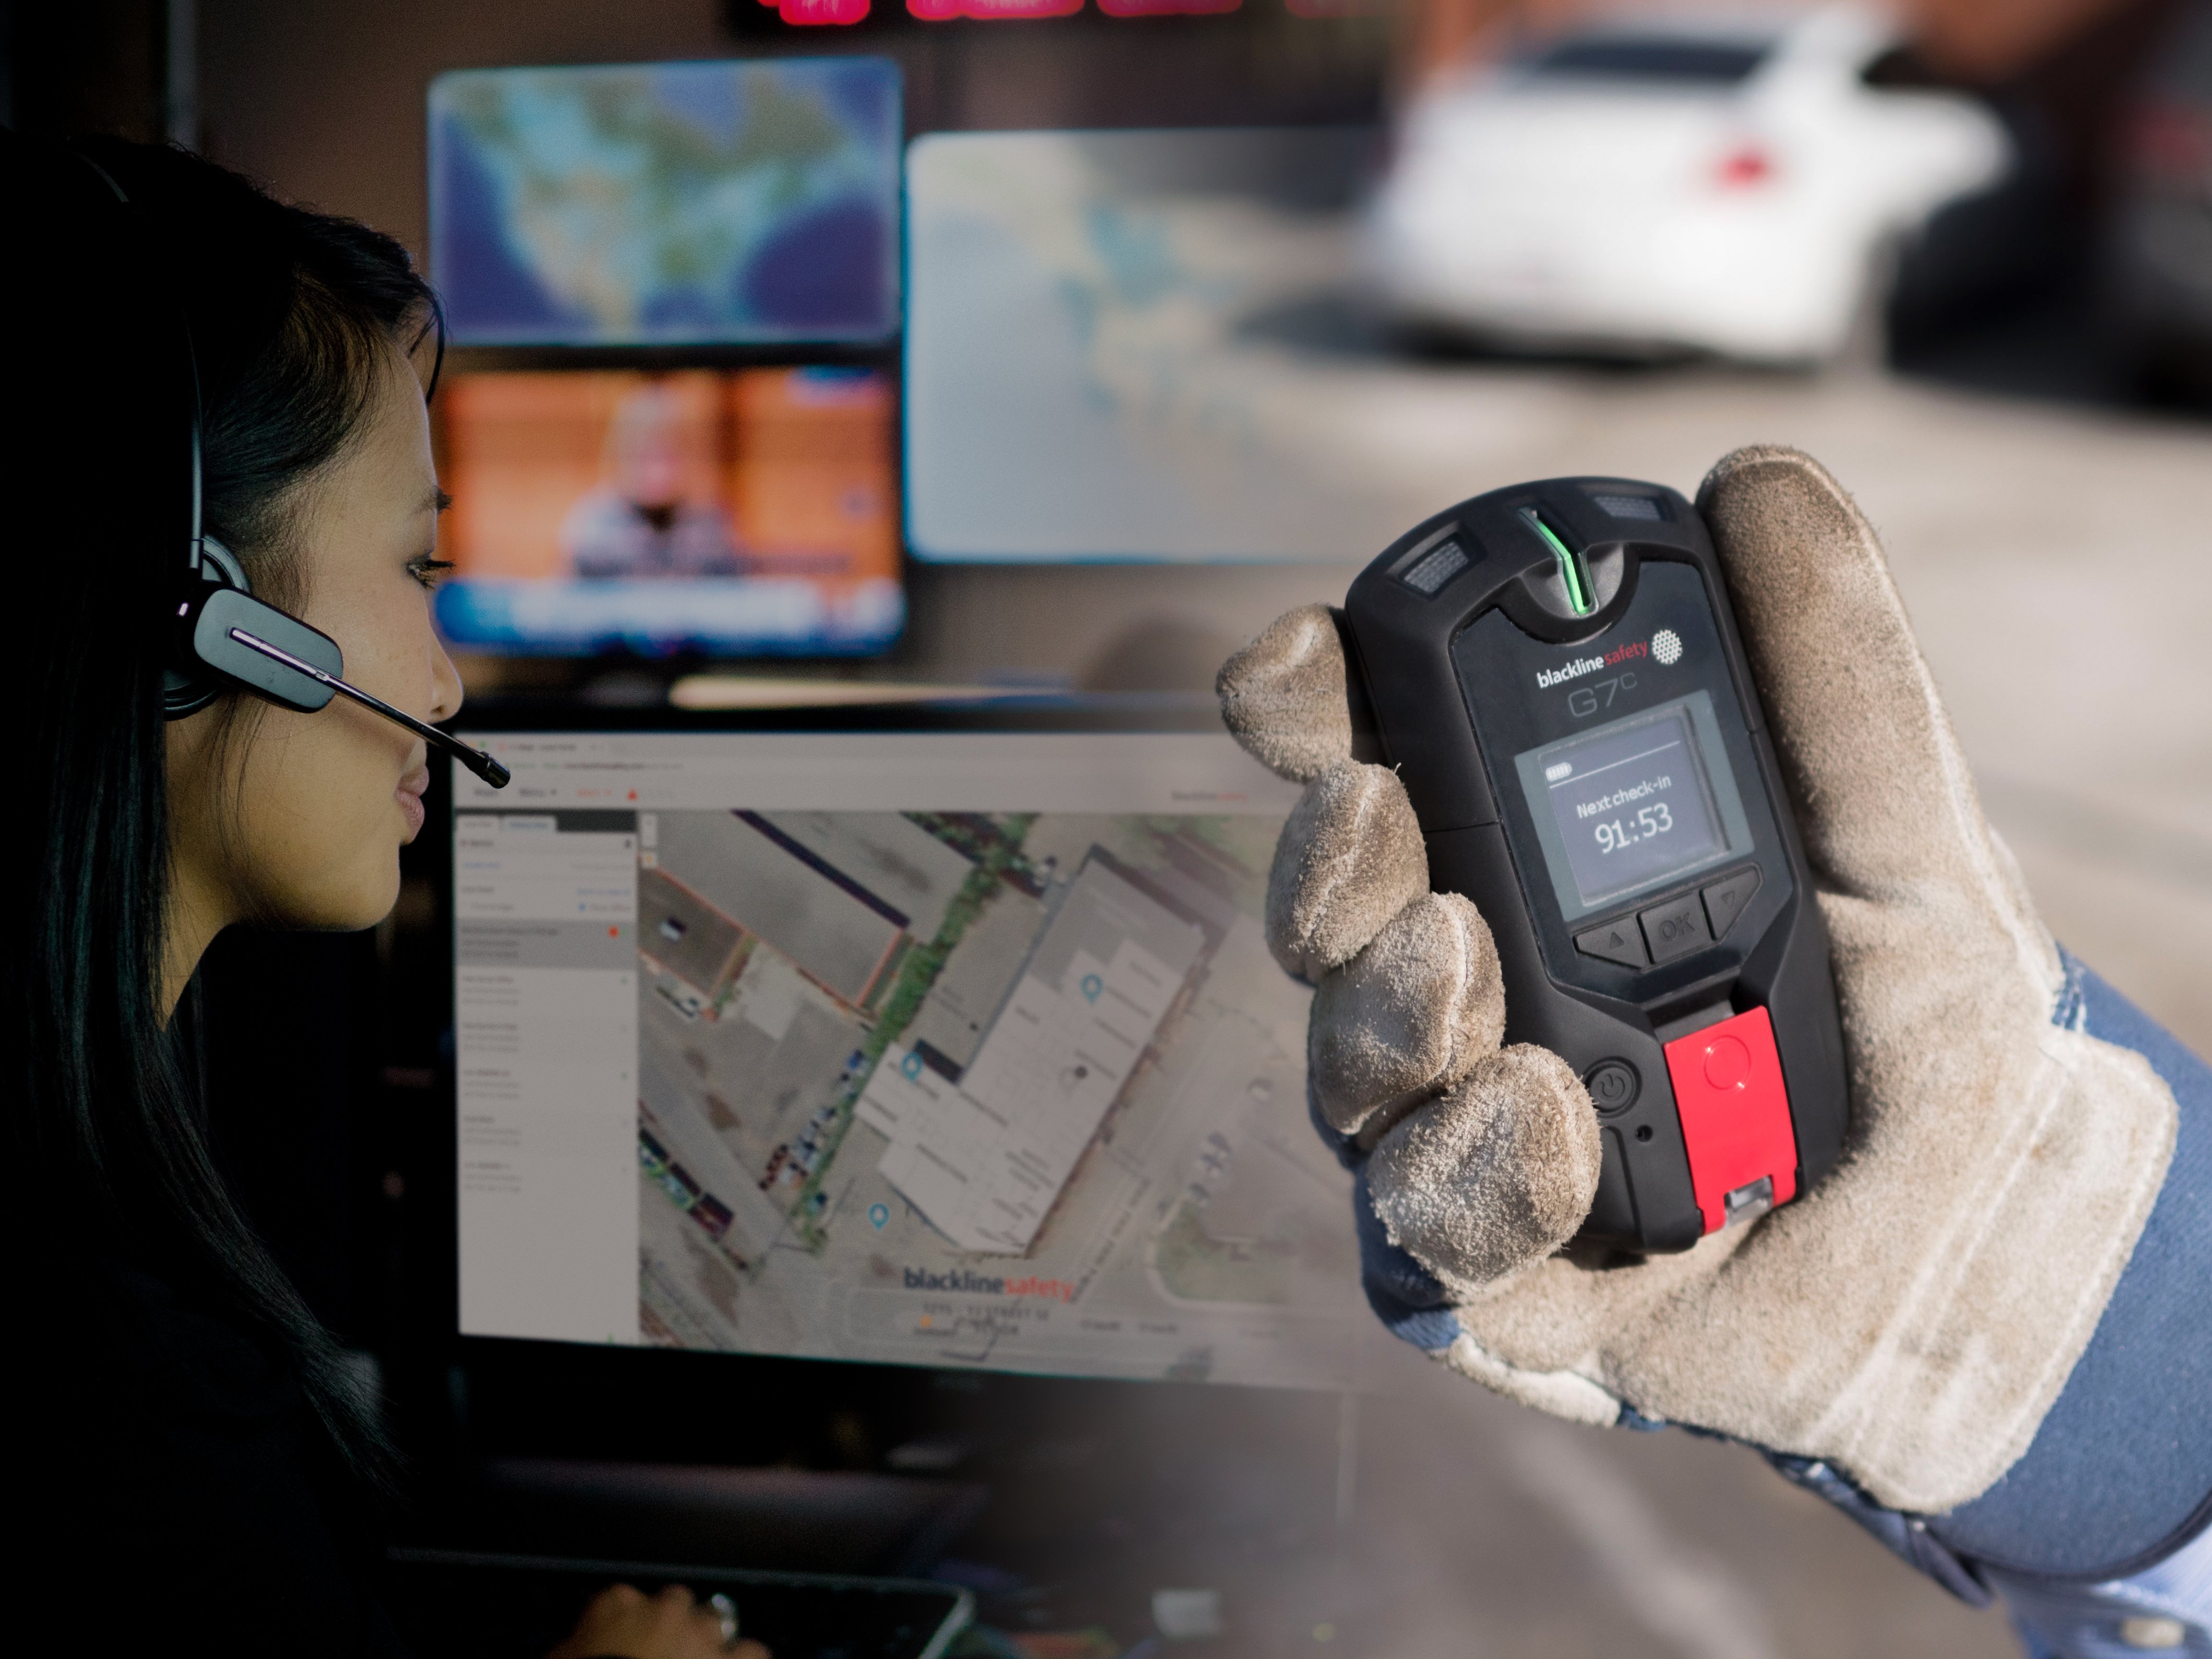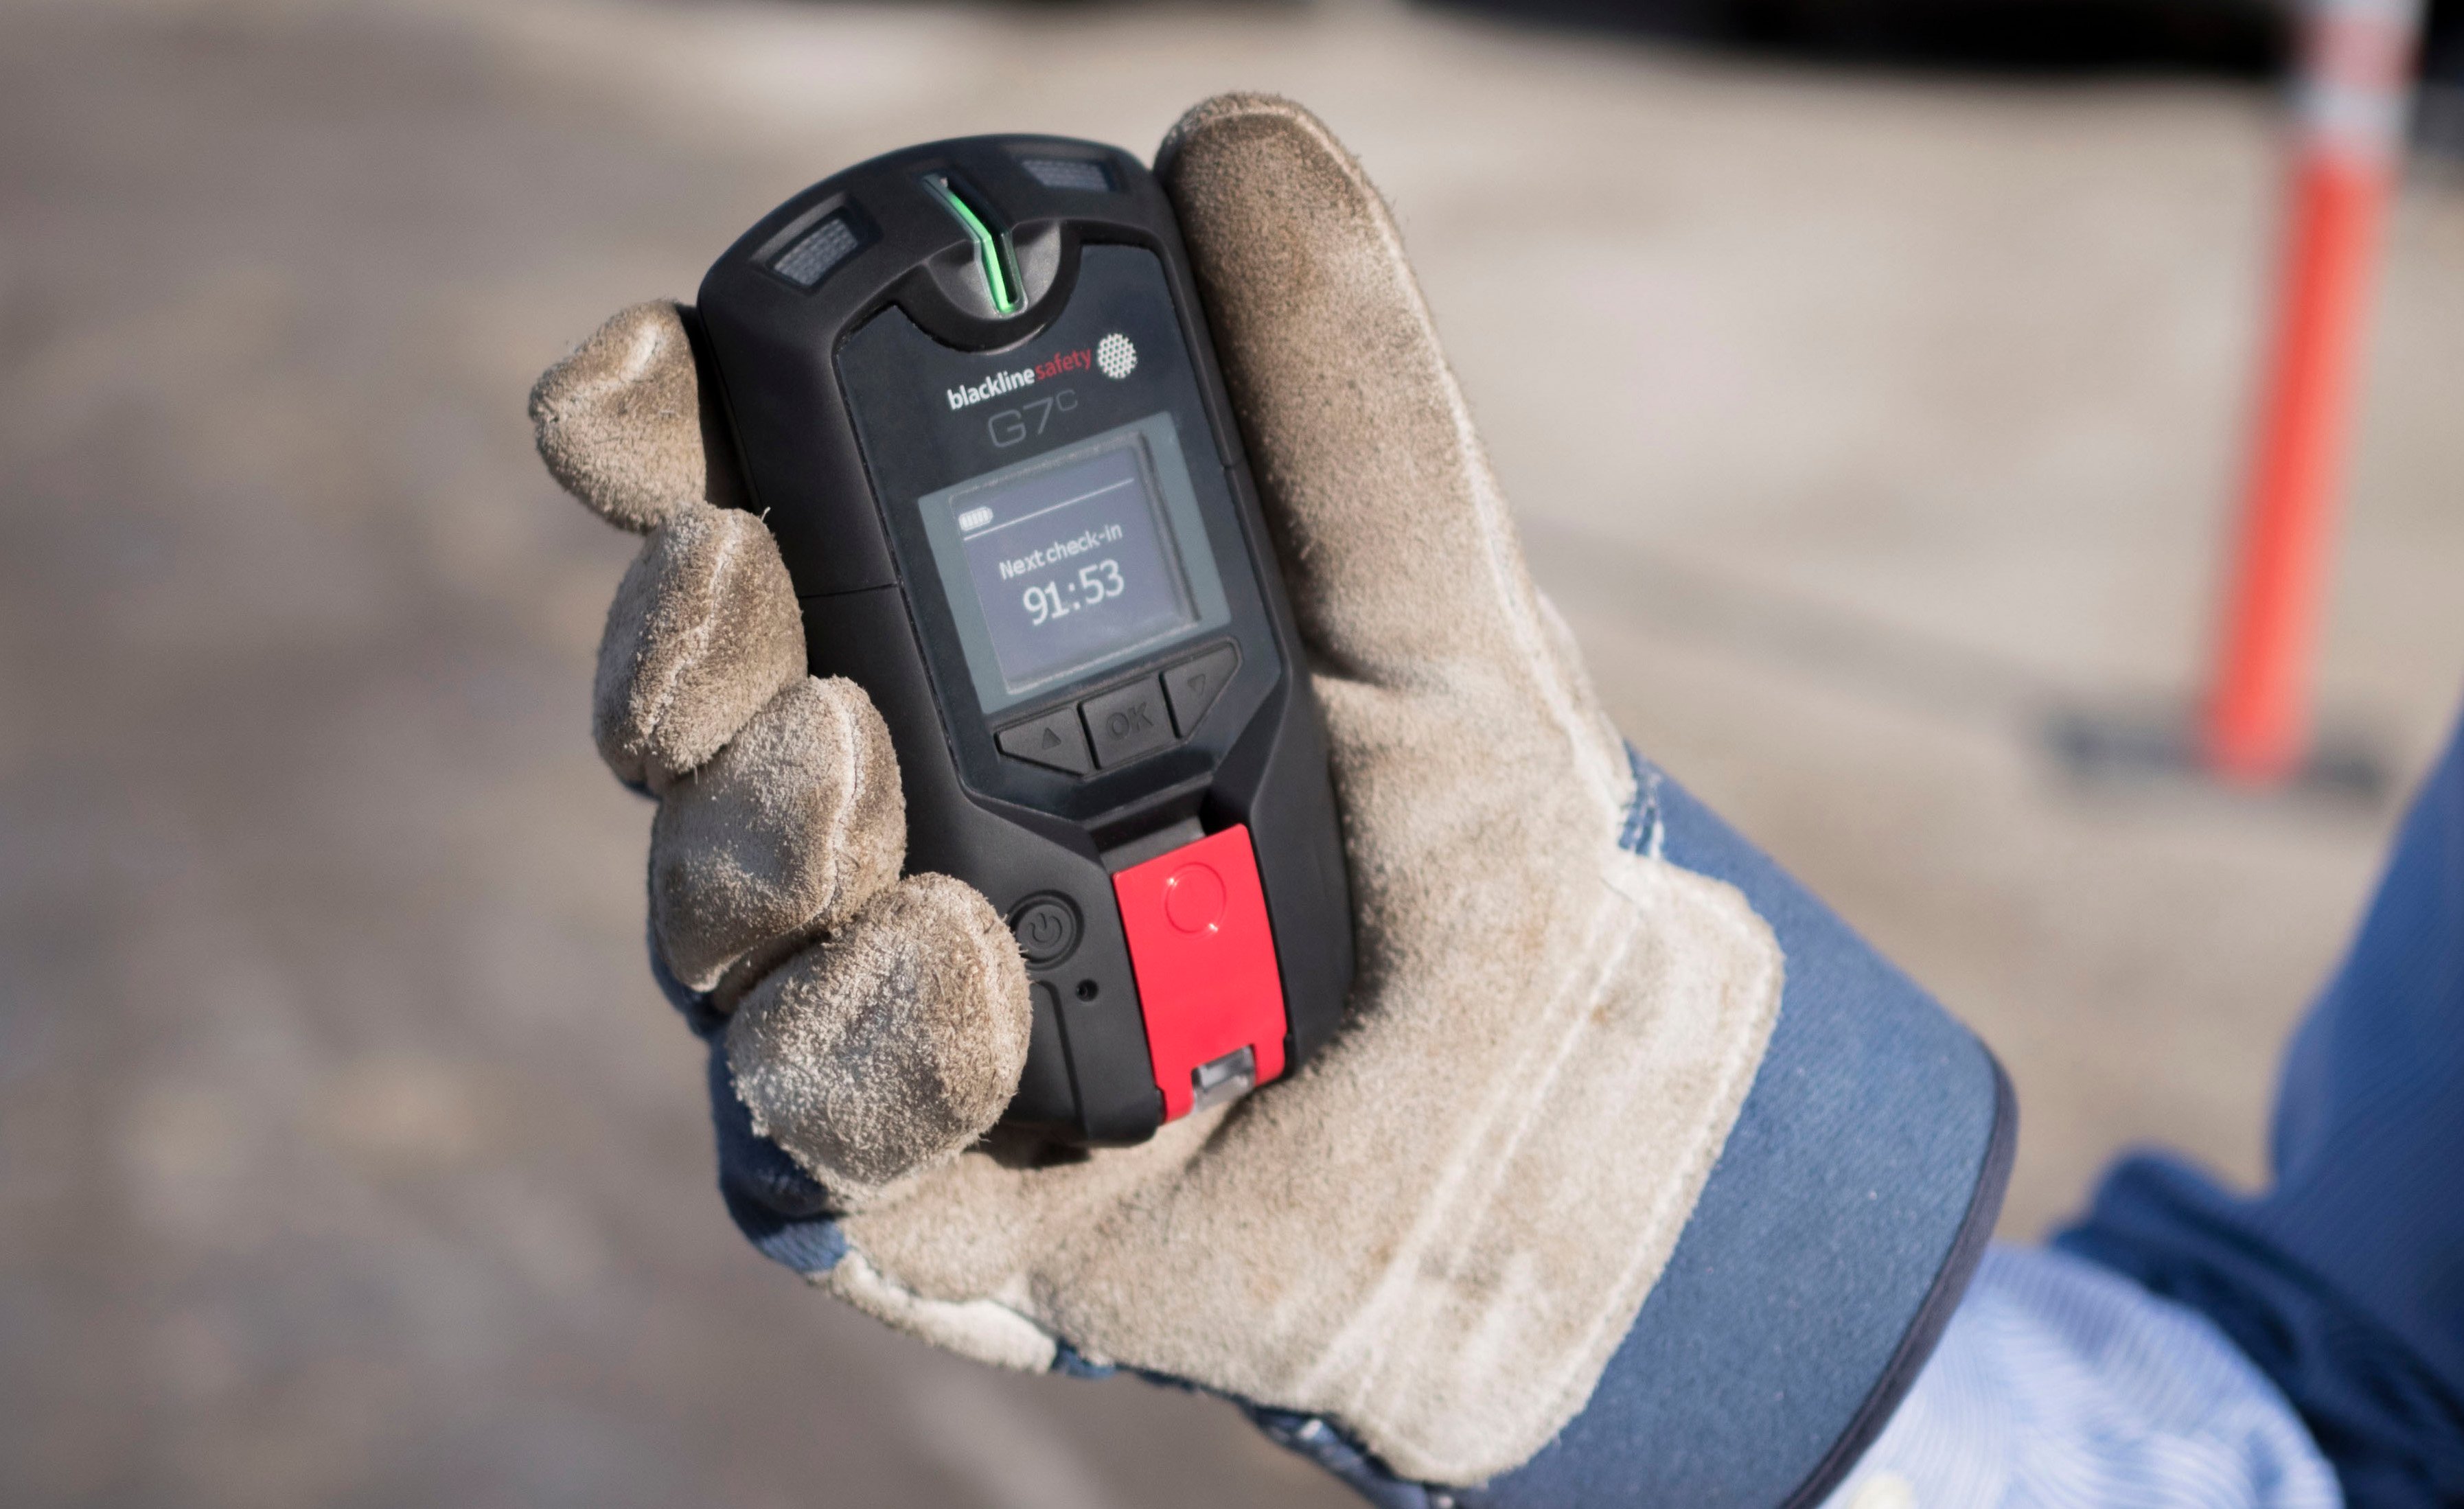
G7 devices equipped with a standard (no-gas) cartridge function as personal safety and lone worker monitoring devices. In the event of an emergency, G7 wirelessly connects your team members with live monitoring personnel to mobilize and manage the fastest possible emergency responses. G7's with a standard cartridge monitor worker safety and alert monitoring personnel in the event of an evacuation, fall or health event.
All data generated by G7 wearables is location-enabled and automatically uploaded to our cloud-hosted Blackline Safety Network. Within your online Blackline Live account, it's easy to leverage large volumes of G7 data using our Blackline Analytics software. Driven by Microsoft's Power BI, Blackline Analytics seamlessly takes care of record-keeping, visualization and analysis.
G7 delivers complete customizability with an exclusive modular design to accommodate diverse gas detection and safety monitoring and lone working needs.
Blackline designed G7c to address every facet of your safety program. With 3G and satellite connectivity, our technology automatically watches over team members and calls for help, even when the employee can’t.
Potential fall and no-motion events automatically trigger a pending alarm, asking you to confirm that you are OK — G7c will escalate pending alarms to alerts — these alerts are then communicated to monitoring personnel. G7c’s red SOS latch lets you manually trigger a call for help when assistance is required, automatically connecting you to a monitoring team.

The connectivity behind G7 means that all devices automatically upload usage and compliance data to the Blackline Safety Network. Through our Blackline Analytics platform, businesses can see the exact whereabouts of their lone workers and what hazards they were exposed to throughout the work day. Instead of manually compiling data to get an idea of teams' activities, G7 automates day-to-day workflows, delivering more data and insights than ever before.
Blackline Analytics provides measurable insights and allows teams to dive deeper into data trends that help empower their business. Through a series of reports, teams can view events and usage data per user, group, organization, type of data and even type of gas sensor. Date ranges or groups can also be selected to compare data side-by-side.
