Blackline Analytics — Empowering Decision-Making with 'Big Data'
Kirk Johnson
July 17, 2018
Blackline's connected solutions generate large volumes of data compared to traditional systems. With the launch of our Blackline Analytics platform, it's never been easier to dive deeper into data to uncover safety insights that help to power your business. G7 gas detectors constantly monitor a range of safety signals — from ambient gas readings to falls and missed check-ins — streaming it back to the Blackline Safety Network when in areas of 3G connectivity. This 'big data' is seamlessly compiled in Blackline Analytics for simple review and comparison. Manually retrieving gas detection data logs from the field, compilation and reporting is a thing of the past.
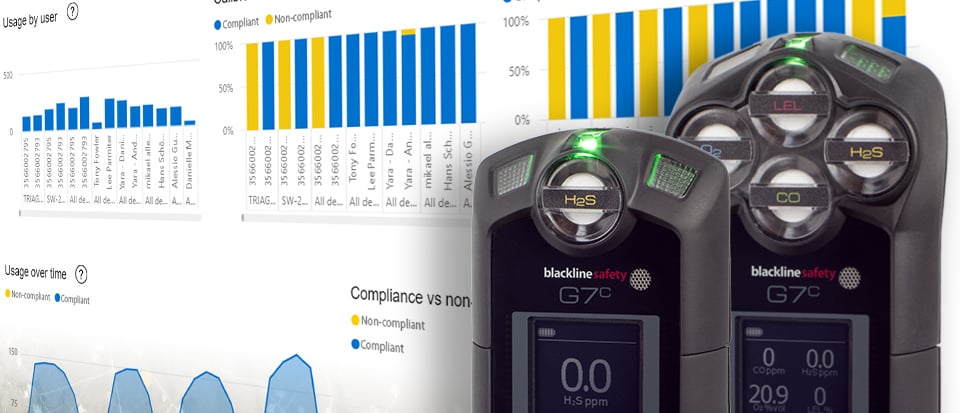
Available to all customers, Blackline Analytics enables businesses to leverage the data streamed from their G7 devices in the field, yielding efficient insights and informed decision making. In short, it delivers a current, real-world view of your fleet's operations and compliance status, without any of the productivity-draining activities of conventional gas detection systems. Our new analytics tool is built directly into Blackline Live, accessible to your team members with log-in access, from any internet-connected device.
For more information on the Blackline Analytics reports, visit our support site article.
 Big data, big insights
Blackline Analytics launched with five reports that deliver visual summaries of data collected by G7s in the field. Each report leverages data received from G7 devices and transforms it into comprehensive maps, graphs and tables that can be customized to view what's most important to a business. Data presented in the reports can be used to review asset maintenance, usage, compliance status, alert and location history, and more.
Events report
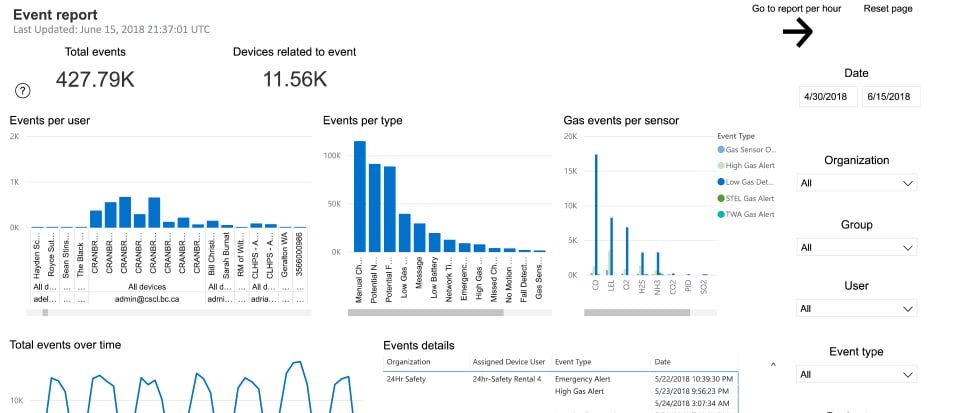
This report delivers a high-level overview of all data collected from a fleet of G7 gas detectors in the field. Teams can drill down using a series of filters to view the information that's important to them, including events per user, group, organization, type of data and even gas sensor variety. The report displays data trends over time so businesses can monitor how employees are making use of gas detection equipment, keeping it in working order and easily identify areas of potential optimization.
Events map report
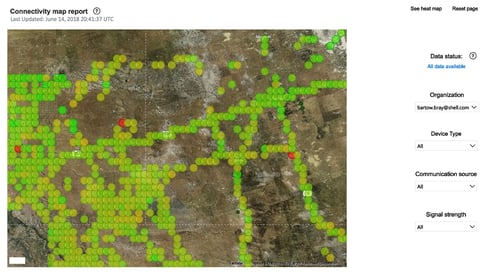
All the data reported to the Blackline Safety Network by G7 gas detectors is location-enabled. The events map report identifies where events occurred, and can be filtered to highlight specific date ranges. Businesses can explore the type and location of events, to look for potential hazards. During a period of time, multiple events in a single location may indicate a recurring issue that may require mitigation or maintenance.
Incident report
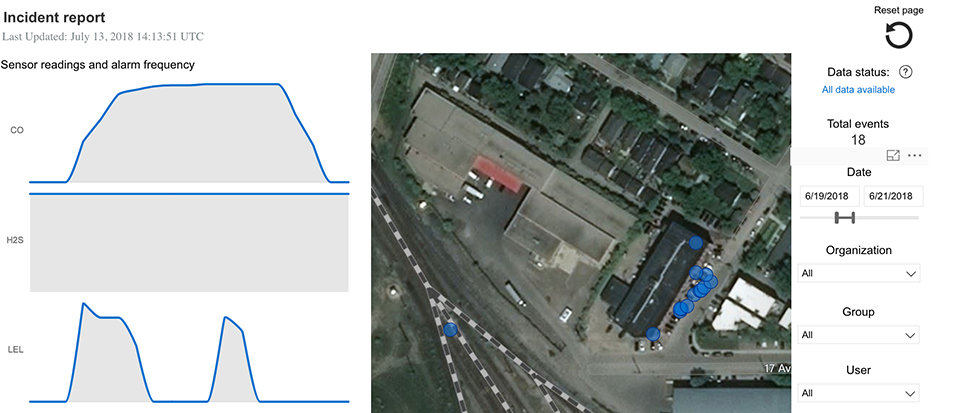
This report helps teams find out what happened during a specific incident that occurred at a particular point in time. The report displays gas readings during the time period that links to locations on a map, for easy comparison and visualization of the event. While this report helps to explore an incident for a single individual, other team mates can be added to the filter that helps to establish the order of events that occurred during the incident, and whether or not they were related.
Usage and compliance report
This report presents regulatory gas detection and usage compliance data per user, group or organization. Teams can dive deeper to identify trending usage and gas detection compliance status over time, plus review how teams are using their devices and to track usage over time.
 Bump test and compliance report
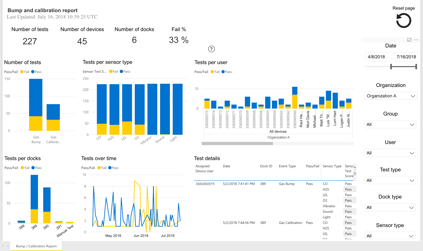
Businesses can use this report to investigate its gas detection fleet's compliance data, examining each test and calibration performed, and identify and manage the cause of any failures. Users can see which tests were successful and if they were performed manually or with a G7 Dock. Data can be broken down by gas sensor or G7 device specifically, making it easy to pinpoint whether a docking station may not be configured correctly or if a sensor should be replaced. This is a good time to mention that our G7 plug-and-play cartridges make it easy to eliminate downtime due to a failed sensor — cartridge replacement only takes a few seconds.
Blackline Analytics — G7 Insight
Blackline Analytics is a key component of G7 Insight, our new gas detection program that targets the mainstream gas detection industry. It one-for-one replaces traditional gas detectors with a new G7. With nearly no change management, each G7 gas detector communicates compliance data and location-enabled gas readings with just a few minutes of connectivity per day. All data is automatically sent to the Blackline Safety Network for automated compliance reporting and analytics.
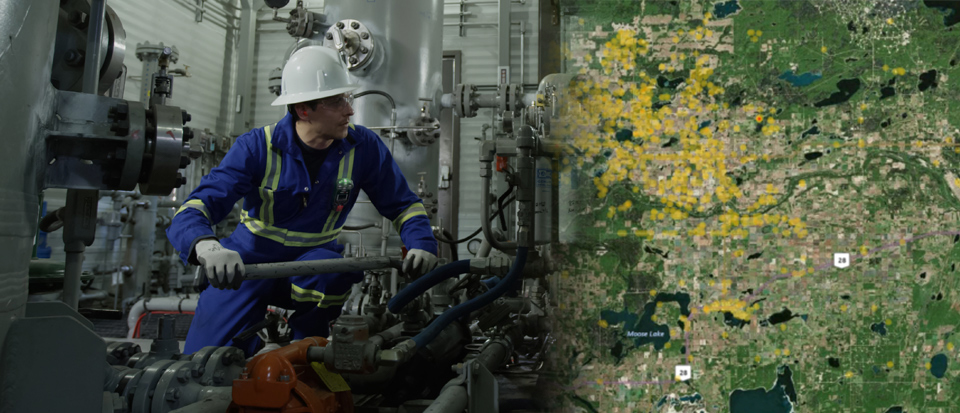
Blackline Analytics compiles the data from fielded G7 gas detectors, allowing for a complete, real-world view, including areas where there may be potential gas leaks. Businesses can clearly identify which assets are being used properly and which can be better utilized, even which docking stations are under-utilized.
Confined space entries and leak checks
Blackline Analytics will be a key component of Blackline's upcoming confined space entry system, part of our G7 Insight gas detection program. Businesses will be able to easily see who entered confined spaces, where, when, for how long and if any hazards were encountered. Our new G7 Multi-gas Pump Cartridge will be launching this fall.
More reports on the way
We have additional Blackline Analytics reports on the way — Let us know if there are any particular reports that you would like to see in the near future or if you have any questions.
Get In Touch
Let’s start a discussion about your safety challenges and needs.
Related Blog Posts
EXO Detects Underground Danger
April 04, 2025
It started with a strange sight—bubbling groundwater just outside the offices of Blackline Safety channel partner Aegis Safety in Brisbane,...
Real-life Incident: Lieutenant Anderson II’s Story – The Silent Killer
February 25, 2025
‘The absolute worst atmosphere I've seen': How G6 alerted first responders to lethal CO levels The scene that greeted firefighters as they...
Real-life Incident: Anna’s Story – Heart Attack While Working Alone
January 22, 2025
‘Please hurry!’How Anna’s G7 Saved Her Life Pain ripped through Anna’s chest and back, taking her breath away. She felt dizzy and like she was...


